
Visual Anomaly Detection Without Code - Just Prompts
We Tried Visual Anomaly Detection Without Code - Just Prompts
“What if we could do industrial inspection without code, labels, training, or even a camera—just prompts?”
TL;DR: We tested whether a vision-language model like Gemini can detect defects in real-world images—just by prompting, with no code or training. The results align with our expectations: this prompt-only approach showed strong potential for practical anomaly detection.
A Simple Test, A Big Question
Imagine you’re trying to inspect a product for defects — a broken part, a missing screw, a scratch. Traditionally, you’d need to build a machine learning system, train it on clean data, write a bunch of code, and hope it generalizes.
But what if you could skip all of that?
What if you could just upload a picture, describe what you’re looking for in plain English, and let a powerful AI model do the rest?
That’s the question our team asked.
We were curious: Can today’s vision-language models (like Gemini or GPT-4 with image input) detect anomalies in images just by being prompted—no coding, no fine-tuning, no tools?
So we built a tiny prototype.
It wasn’t a research paper. Just an experiment.
- We didn’t train anything.
- We didn’t even provide any examples or description of the anomalies.
- We didn’t write a computer vision pipeline — just provided a generic desciption of the steps.
- We didn’t even use a camera — just uploaded some test images.
And what we found was in line with our expectations. It wasn’t perfect—but it wasn’t useless either.
So in this blog, we share:
- How we built a prompt-only anomaly detector
- What we observed—warts and all
- And how it fits into the broader state of the art in anomaly detection
Let’s dive in.
Why Prompt-Only?
Detecting anomalies in images—like defects on factory lines—has come a long way. But making it work at scale is still a challenge.
Traditional AI approaches need:
Lots of labeled images
Expensive computing to retrain models
Engineering time to keep everything running
Even so-called “zero-shot” methods (which don’t need training data) still require setting up tools like CLIP, writing code to compare image patches, and combining multiple models.
We didn’t want to do any of that.
- We had access to a vision-language model (VLM)
- We knew how to describe what we were looking for
- We didn’t want to build an ML pipeline
Our Prompt-Only Prototype
To test this, we built a minimal app using Google AI Studio and Gemini 2.0 Flash (gemini-2.0-flash) model which offers cheaper API calls.
Note: We were able to use Gemini 2.5 Flash (
gemini-2.5-flash-preview-04-17), but we deliberately tested with Gemini 2.0 Flash (gemini-2.0-flash) to see how well a basic, low-cost model could handle the task.
The setup:
- We upload an image.
- A single, structured prompt guides the VLM through anomaly detection.
- The model:
- Detects and describes objects
- Analyzes each detected object for potential defects
- Highlights anomalies and explains them in plain language
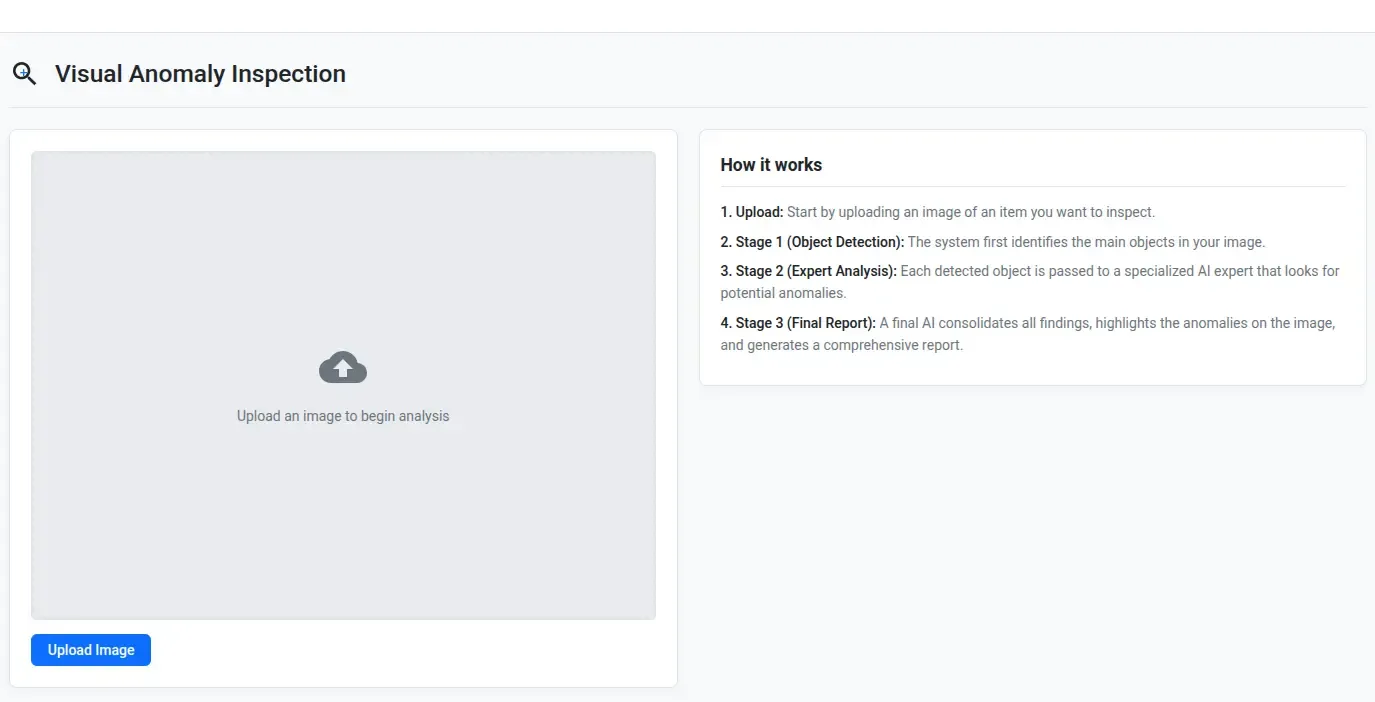 Minimal web app interface built in Google AI Studio. Just upload an image—no code required.
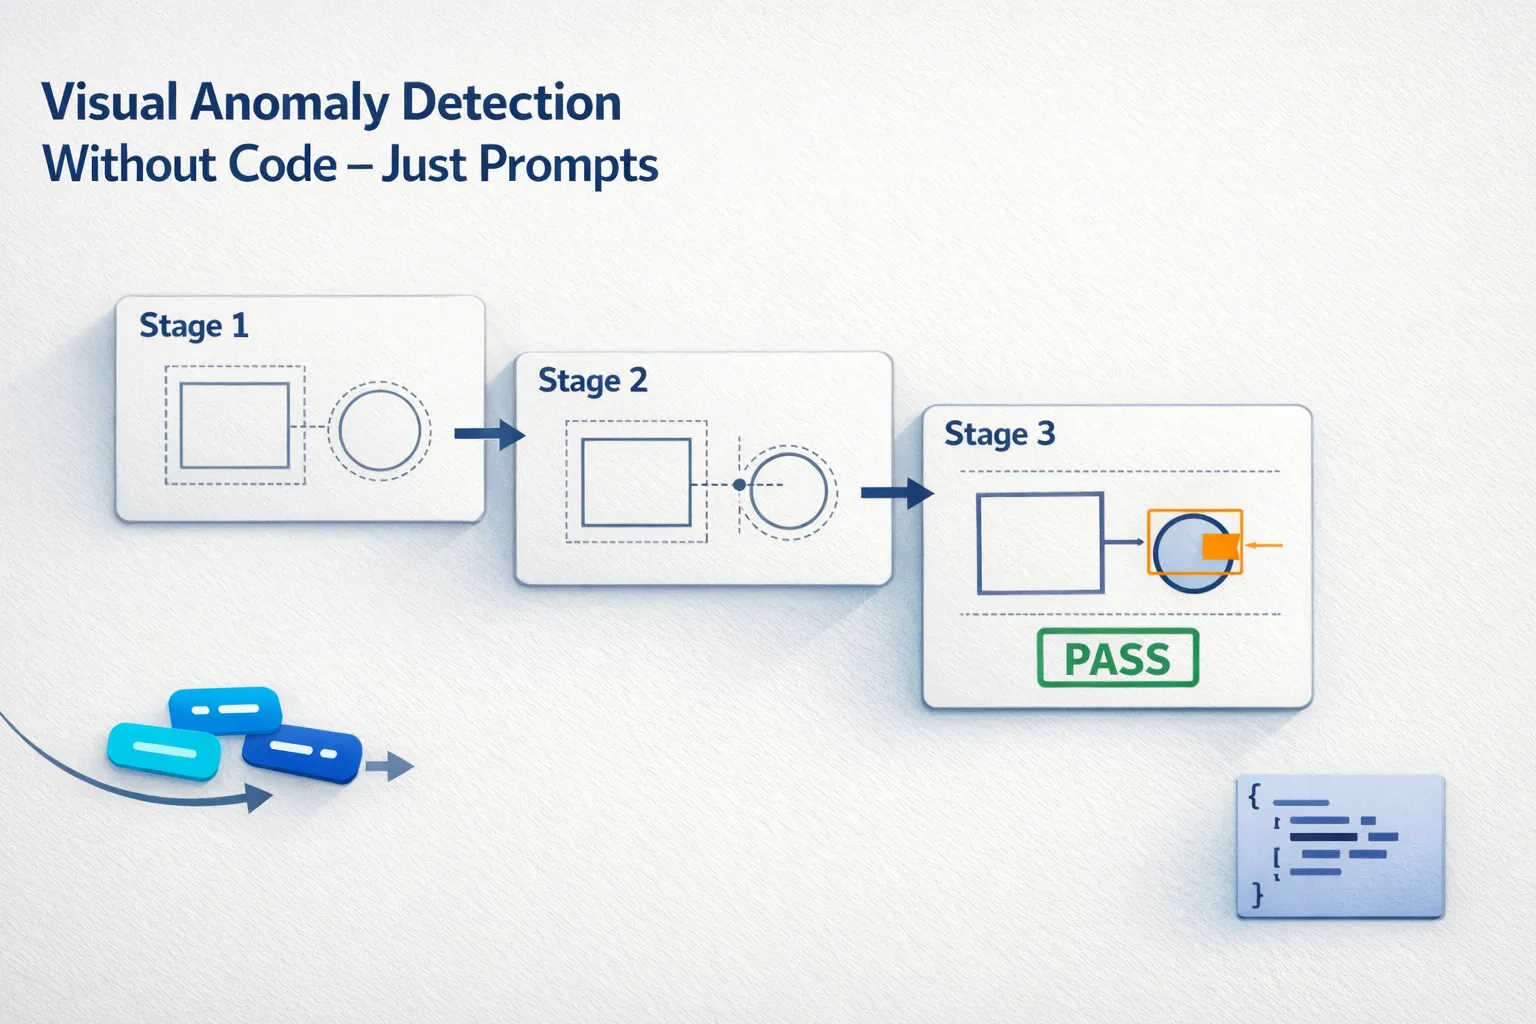
The whole system runs on one carefully crafted system prompt, divided into three stages:
Prompt Logic (3 Stages)
-
Stage 1: Object Identification
The model identifies visible objects and parts in the image. -
Stage 2: Detailed Inspection
Each object is analyzed for irregularities, missing parts, or visual oddities. -
Stage 3: Anomaly Decision
A summary prompt combines all previous outputs into a final answer with highlighted anomalies and explanations.
All of this happens inside the off-the-shelf model—no fine-tuning, no external tools, no segmentation masks, no embedding comparisons.
While the model may internally use some tool-like capabilities (e.g. localization or reasoning), we don’t install anything ourselves, but simply provide a prompt.
Click to view the full prompt used in our prototype.
Build a visual anomaly inspection application.

The user experience is simple and fully automated:
 1. The app is configurable by a 3-stage system prompt.
 1. The user uploads an image
 2. The app sends the image to a vision-language model (VLM) that has 3 stages, along with the corresponding prompts written for each stage.
 3. The model uses independent VLMs for each stage that work as per the following brief explanation:
   i. Detects and describes objects in the image
   ii. Analyzes each object for visual anomalies
   iii. If any are found, it highlights the region and provides a natural language explanation
4. The app organizes the prompts for the 3 stages in a separate file, so that the developer may easily update them at a later time.
5. The app also organizes the models used for the 3 stages in a separate file for easy edit by the developers.


More details of each stage:
Stage 1:
  - Description: This stage has a single VLM that can identify various objects in the given image. It strictly identifies the entire objects and not the sub-parts, but can describe them in text as being parts of the objects.
  - Input: Image.
  - Output: JSON containing a list of detected objects where for each object it provides:
    - Object ID (int)
    - Label (str)
    - Short description (str)
    - Object bounding-box starting from the top-left corner and normalized to the size of the image ([xmin, ymin, width, height])

Stage 2:
  - Description: This stage has multiple VLMs viz., one expert for each object class (Label) that analyzes the objects of that class in extreme detail. This stage assigns the objects detected in Stage 1 to the individual experts based on the detected Label, and the experts provide their opinion for possible anomalies and their locations.
  - Input: Image and the JSON generated by Stage 1.
  - Output: JSON containing a list of detected objects where for each object it provides:
    - Object ID (int)
    - Detailed analysis of the object (str)
    - List of anomalies (list) which includes:
      - Anomaly ID (int)
      - Anomaly description (str)
      - Anomaly bounding-box starting from the top-left corner and normalized to the size of the image [xmin, ymin, width, height]
      - Textual description of the anomaly location pinpointing it in the image considering the viewer-centric frame of reference (str)

Stage 3:
  - Description: This stage is the meta-expert single VLM that gathers the opinions of the previous two stages and does its own assessment, and then provides its final judgement for each object about whether or not it has an anomaly. It can accept/reject/refine the assessment done in Stage 2.
  - Input: Image and JSONs generated by Stage 1 and Stage 2.
  - Output: JSON containing a list of detected objects where for each object it provides:
    - Object ID (int)
    - Has anomalies (bool)
    - Anomaly description (str)
    - List of anomalies (list) which includes:
      - Anomaly ID (int)
      - Anomaly description (str)
      - Anomaly bounding-box starting from the top-left corner and normalized to the size of the image ([xmin, ymin, width, height])
      - One line description of what should be normal (str)
      - One line description of why the anomaly may have occurred (str)
      - One line description of possible ways to avoid this anomaly (str)
      - Textual description of the anomaly location pinpointing it in the image considering the viewer-centric frame of reference (str)


More details about the user interface (UI):
1. Has a title and a logo on the top. The UI is then divided into two parts. On the left you show all the image and controls, while on the right you show only the dynamically generated display areas for displaying text.
2. Below the title, in the right half it has an upload image button. Once the image is uploaded, the image is shown and the app automatically calls each of the 3 stages sequentially.
3. Below the image, there are two checkboxes, one for the object and another for the anomalies. These are used to show/hide the detected objects and anomalies.
3. Below the checkboxes is a progressbar. As the image passes through each step, the progressbar is updated to show what stage is being performed.
4. At the end of every step a display area is dynamically generated one below the other to show the textual output in it. These are all displayed in the right half.
5. The bounding boxes received from each stage are aligned with the image shown on the canvas in the left half. The app ensures that the bounding-boxes are correctly overlayed on the image.
6. The output of Stage 1 is used as:
  - Object bounding-boxes and Label: Overlayed on the displayed image.
  - Label and Description: Shown in the generated display area (textbox)
7. The output of Stage 2 is used as:
  - Detailed analysis: Shown in the generated display area (textbox)
8. The output of Stage 3 is used as:
  - Anomaly bounding-boxes: Overlayed on the displayed image.
  - All the below is shown in the generated display area (textbox)
    - Object Name (get it from Stage 1 with the associated Object ID)
    - Anomalies present or absent shown in bold red and green colors, respectively
    - For each detected anomaly:
      - Description of the anomaly
      - Description of what should be normal
      - Description of why the anomaly may have occurred
      - Description of possible ways to avoid the anomaly
      - Description of the anomaly location pinpointing it in the image considering the viewer-centric frame of reference
9. All the content in each of the display areas is shown with appropriate highlights for clear visibility.
10. The UI is clean yet visually pleasing with information clearly visible wherever needed.
Note: We used a very generic prompt to describe the steps, without explicitly providing any examples or description of the anomalies.
What We Observed
This wasn’t a benchmarked system. But through qualitative testing on a few sample industrial images form the MVTec AD dataset, we noted:
- It could detect many visible anomalies — holes, broken shapes, debris, discoloration
- Explanations were surprisingly good — especially for localized damage
- Responses improved over repeated runs — same prompt and image gave better results within the same session
- Doing easier cases first seemed to help — performance on difficult images improved when preceded by simpler ones
- ⚠ Fine details were missed sometimes — small scratches or subtle deformations went unnoticed
- ⚠ Anomaly boxes were not always good — even when the textual description of the location was good enough
- No repeatability across sessions — same image gave different outputs when re-run later in a new session
- Not real-time — it took 8-10 sec per image, the processing time extended with more detailed prompts
- Difficult to write prompts for fine details — we need to be patient to see if our descriptions give the desired results
Still, it gave us a strong signal: foundation models can do more than expected—even without any fine-tuning or customization.
Here are some of the examples where it worked and failed.
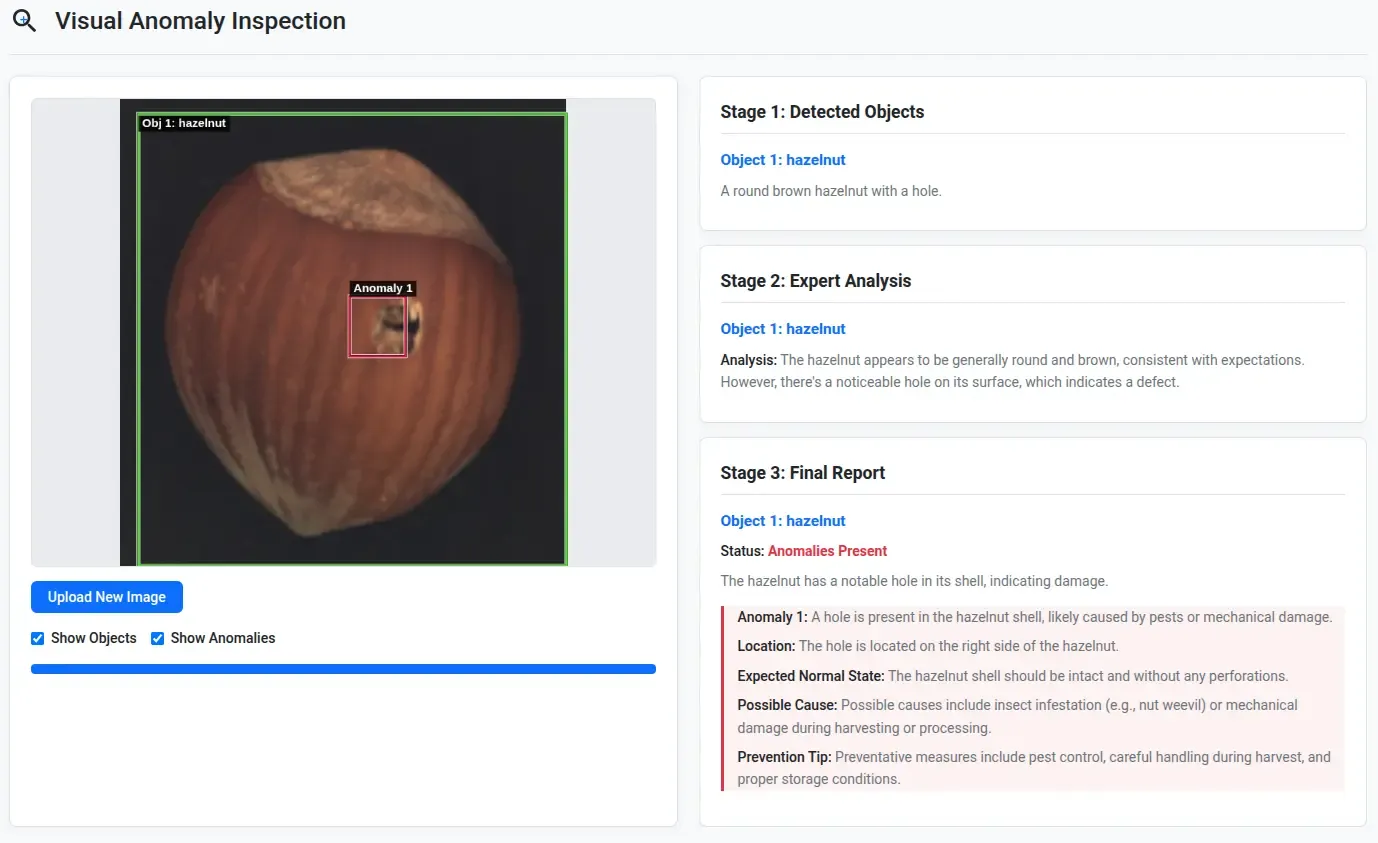
- The anomaly was pretty obvious in the hazelnut and it detected it quite well.
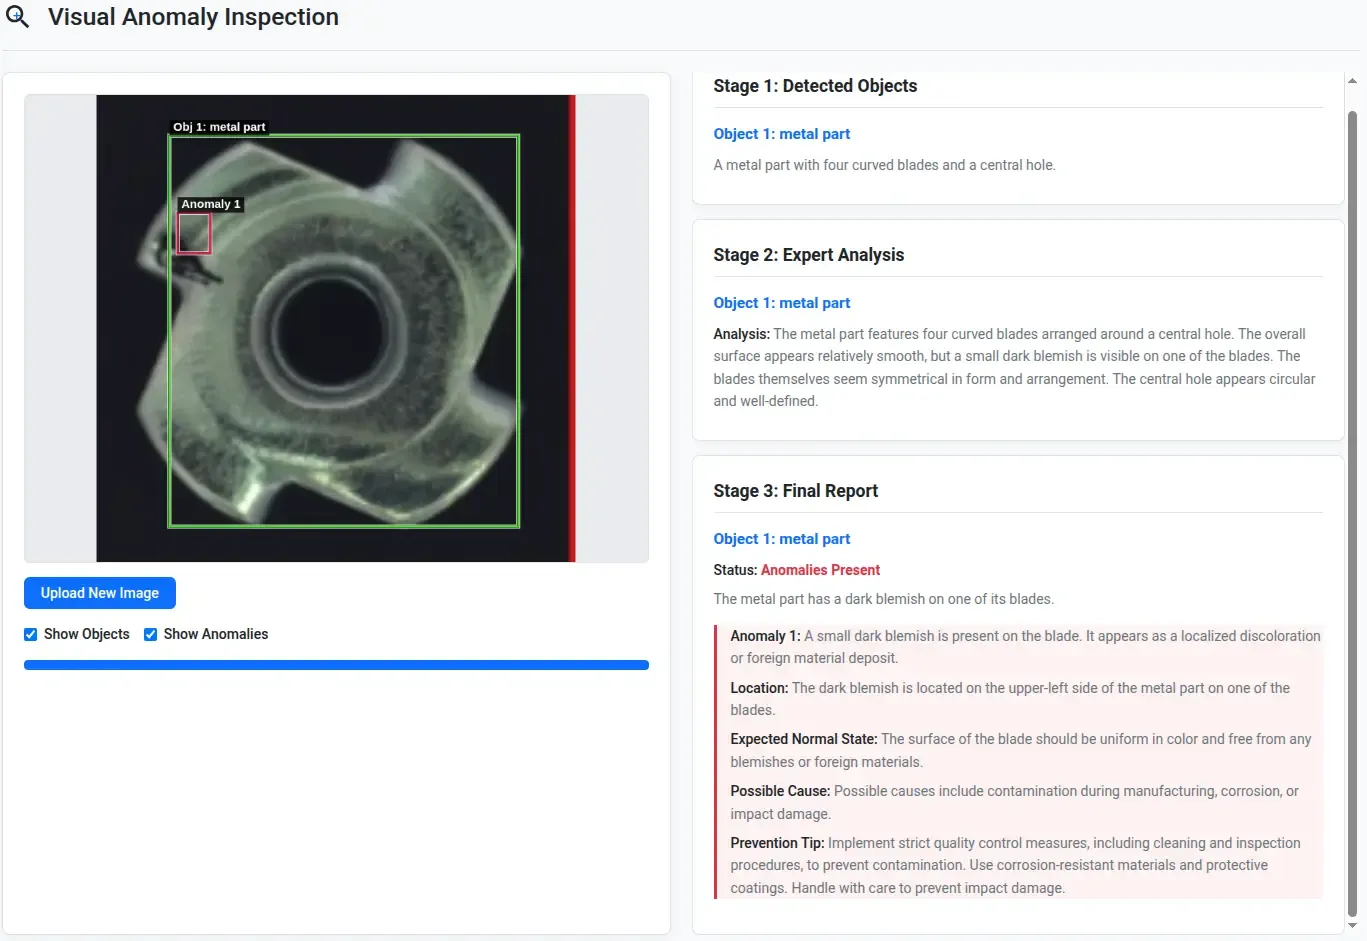
- The anomaly on the metallic blade wasn’t obvious to me, but the model helped detect it.
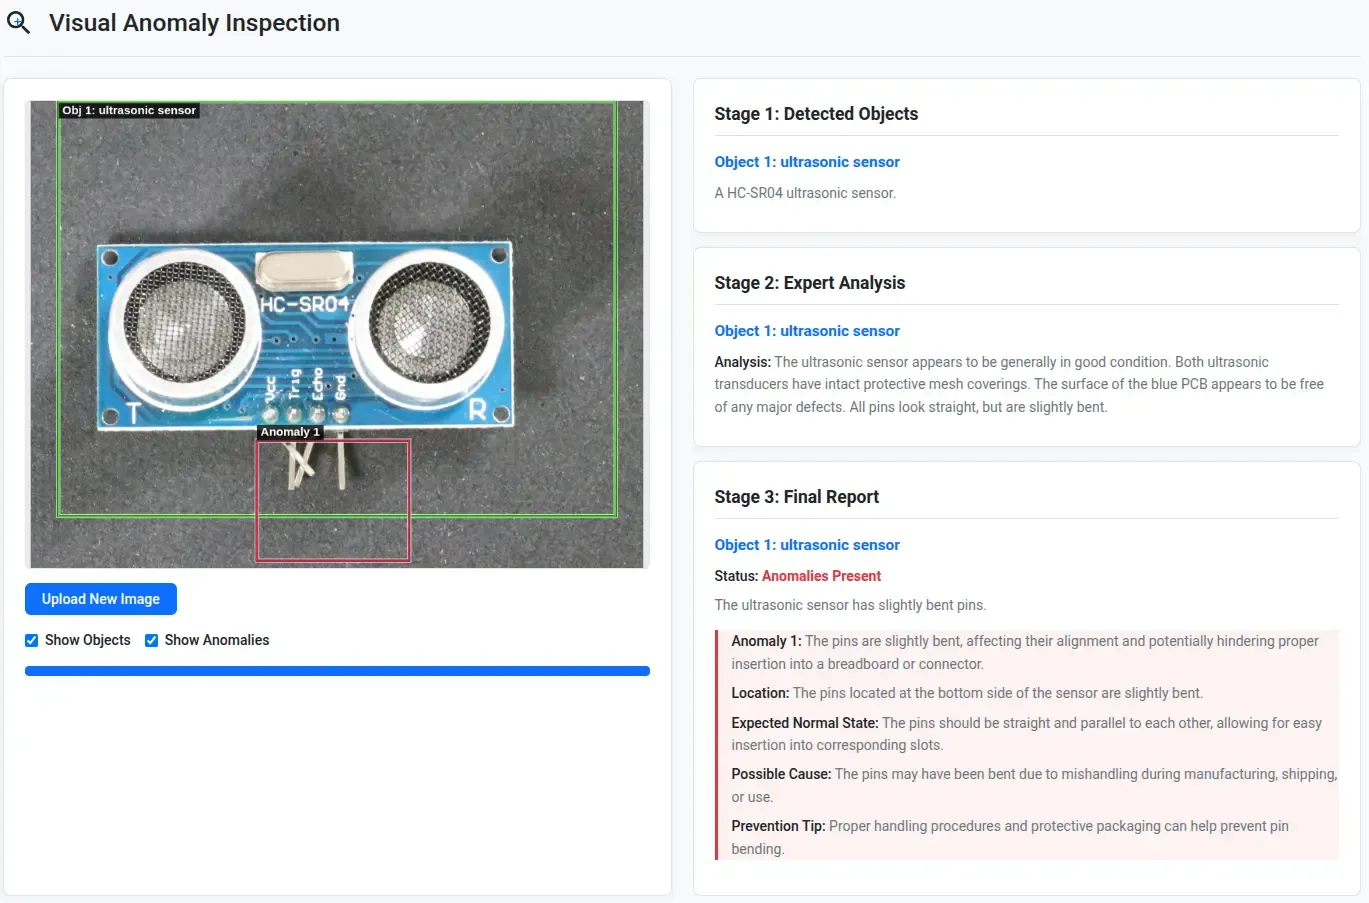
- It worked well for this set of bent pins on the PCB too!
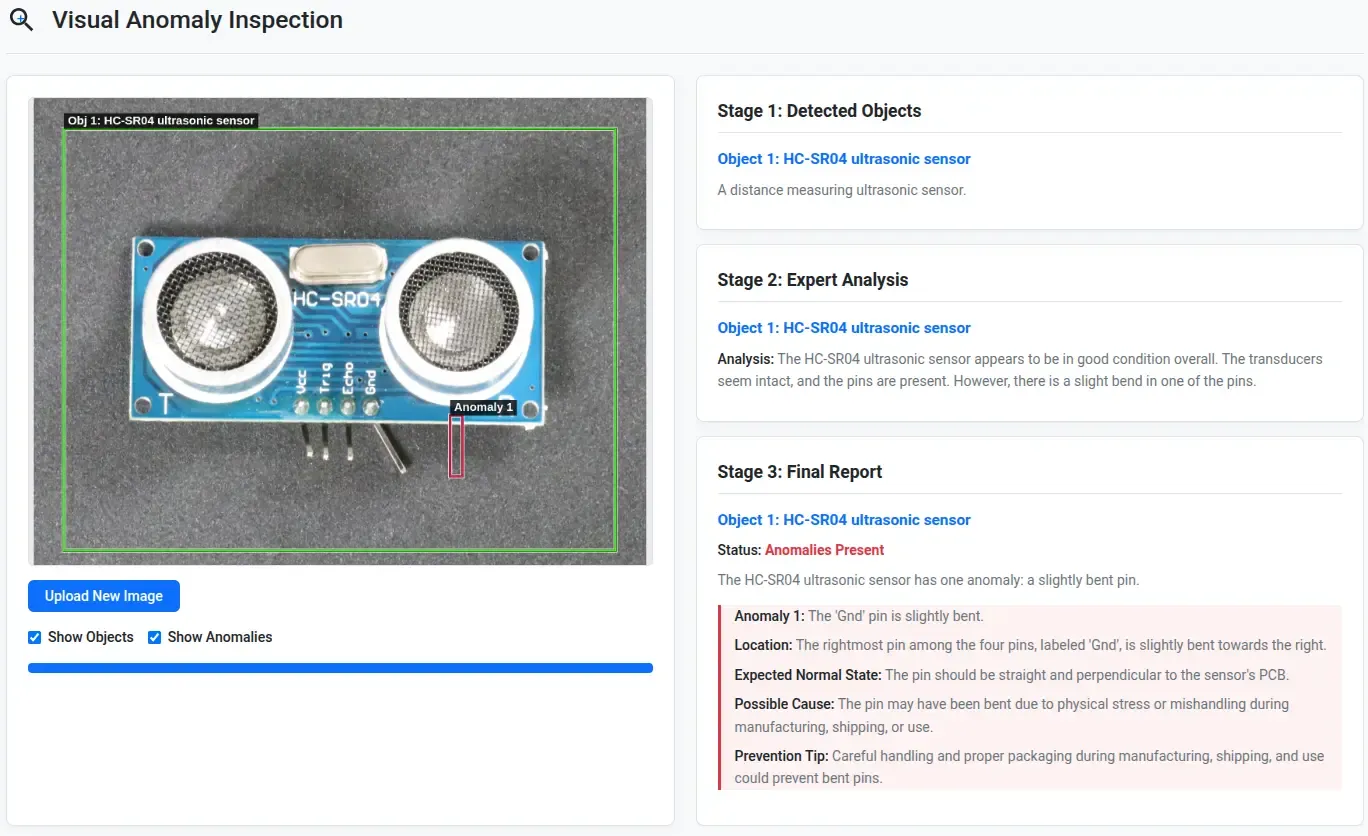
- ⚠ For the bent Gnd pin, it was able to textually tell that it is bent, but couldn’t correctly localize it.
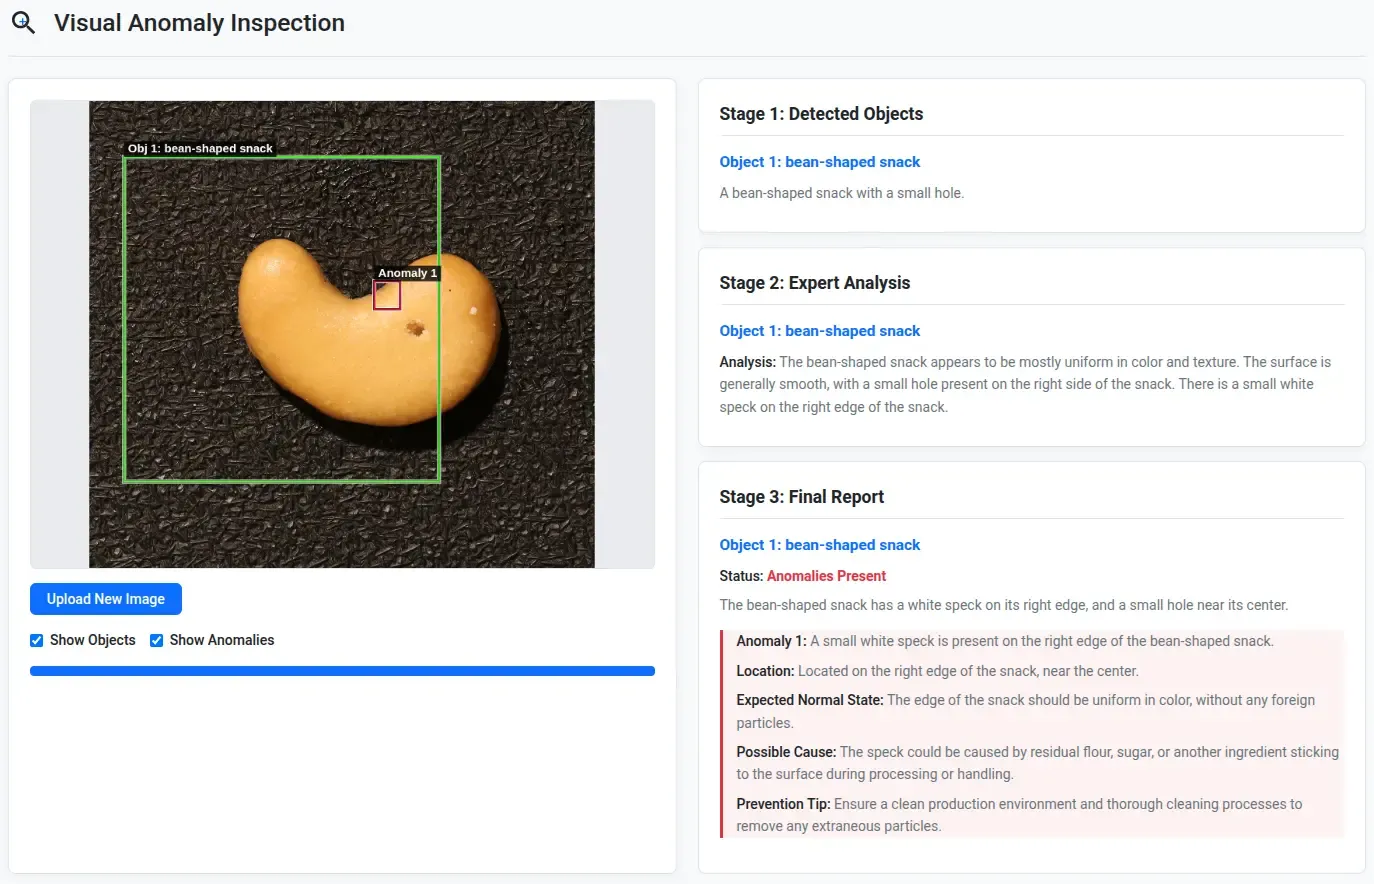
- It completely missed detecting the obvious hole in the cashew, but it did detect the white speck on the edge. In this case, both the bounding boxes seem shifted.
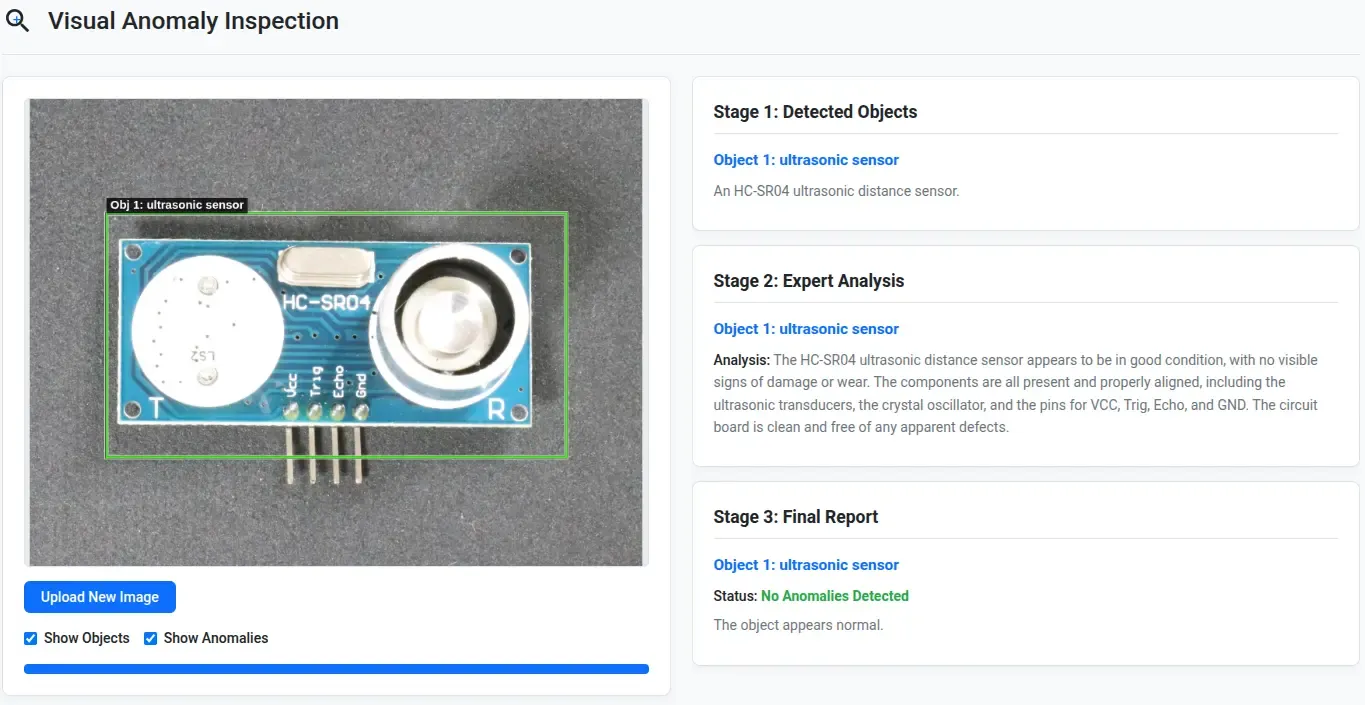
- The model completely failed to detect the missing left transducer as well as the mesh on the right transducer on this HC-SR04 PCB.
Here is copy of the app we built & downloaded from Google AI Studio. You can try it yourself!
Where This Fits: A Quick Look at the Landscape
To understand how our approach fits into current research, we reviewed how visual anomaly detection has evolved.
This isn’t a benchmark comparison — our method wasn’t tested on any shared dataset. But here’s a look at how other methods approach the problem.
Trained Classical Approaches
These methods rely on training traditional models on normal data to detect statistical deviations.
| Method | Venue | Needs Coding? | Needs Training? |
|---|---|---|---|
| PatchCore | CVPR 2022 | ||
| PaDiM | ICPR 2020 |
Prompt-Augmented Pipelines
These methods use frozen vision-language models with engineered scoring or segmentation logic. Some require tuning, others use clever pipeline designs.
| Method | Venue | Needs Coding? | Needs Training? |
|---|---|---|---|
| Anomaly‑OV | CVPR 2025 | ⚠ (trained on Anomaly-Instruct-125k dataset, but users don’t need to train) | |
| FADE | BMVC 2024 | ||
| AA‑CLIP | CVPR 2025 | (adapters for 2 to few shot) | |
| WinCLIP | CVPR 2023 |
Prompt-Only, Zero-Code (This Work)
This blog explores a minimalist path:
No tools, no fine-tuning, no training. Just an uploaded image and a prompt to an off-the-shelf vision-language model.
While prior methods like WinCLIP or Anomaly-OV build sophisticated pipelines, we tested how far plain prompting can go — as a seed idea, not a deployed system.
Benchmarks (for Context Only)
Our prototype wasn’t evaluated on any benchmarks. But for completeness, here’s a list of common datasets used in the community:
| Dataset | Categories | Description |
|---|---|---|
| MVTec AD | 15 | Pixel-level masks, industrial components |
| VisA | 12 | Cluttered anomaly scenes, real-world photos |
| VisA-D&R | 10 | Prompt + reasoning-based evaluation |
And these are the benchmark results reported in the respective papers.
| Method | Dataset | Image AUCROC ↑ | Pixel AUCROC ↑ | Notes |
|---|---|---|---|---|
| PatchCore (full-shot) |
MVTec AD | 99.1 | 98.1 | Patch memory bank + kNN on CNN embeddings |
| PaDiM (full-shot) |
MVTec AD | 97.9 | 97.5 | Multivariate Gaussian modeling of CNN features |
| WinCLIP (0-shot) |
MVTec AD | 91.8 | 85.1 | Patch-aligned CLIP similarity |
| FADE (0-shot) |
MVTec AD | 90.0 | 89.6 | Fusion of anomaly map and CLIP similarity |
| Anomaly‑OV (0-shot) |
MVTec AD | 94.0 | – | Fusion + trained reasoning modules |
| AA-CLIP (2-shot) |
MVTec AD | 91.0 | – | Prompt reweighting to improve recall |
| WinCLIP (0-shot) |
VisA | 78.1 | 79.6 | Patch-aligned CLIP similarity |
| FADE (0-shot) |
VisA | 75.6 | 91.5 | Fusion of anomaly map and CLIP similarity |
| AA-CLIP (2-shot) |
VisA | 93.4 | – | Prompt reweighting to improve recall |
| Anomaly‑OV (0-shot) |
VisA | 91.1 | – | Fusion + trained reasoning modules |
| Anomaly‑OV (0-shot) |
VisA-D&R | 91.4 | – | Fusion + trained reasoning modules |
Color legend: MVTec AD (full-shot) ·MVTec AD · VisA · VisA-D&R
Industry Landscape: Key Players
The field of automated visual inspection is rapidly evolving, with several companies building real-world systems for anomaly detection and quality control.
Companies like Landing AI, Ouen Inc, Instrumental and Neurala are already delivering detection and QA tools across sectors — from electronics and factory lines to edge-based inspection and localized zero-shot systems.
This growing landscape shows just how much demand there is for smarter, more flexible QA.
Our prompt-only prototype explores a radically minimal approach within this space — one that requires no tools, training, or infrastructure, just a smart model and the right prompt.
Final Thoughts
Prompt-only visual anomaly detection won’t replace trained models — at least not yet — but we may be witnessing the beginning of a paradigm shift. The Anomaly-OV paper hints at this direction as well.
This quick exploration revealed something more interesting:
With just a good prompt and a general-purpose model, you can already spot defects, describe them in plain language, and localize anomalies—without writing a single line of ML code.
That’s not just a clever hack. It signals a shift in:
- How we approach the problem using modern foundation models
- Who gets to build and use inspection tools
While this method isn’t competitive with current benchmarked pipelines, it opens up a zero-infrastructure path to rapid prototyping, early-stage QA, and idea validation.
For researchers, startups, or quality teams without access to heavy ML tooling — this might just be good enough to get started.
What’s Next?
To turn this idea into a rigorously validated method, here’s what still needs to be done:
- Benchmarking on datasets like MVTec AD, VisA, and VisA-D&R
- Prompt engineering analysis to study sensitivity, robustness, and localization behavior
- Cross-model evaluation using Gemini, GPT-4V, Claude, and open-source VLMs
- Performance profiling — latency, cost per image, and scalability in real-world setups
- Human evaluation — are the explanations and detections actually helpful in QA workflows? (The VisA-D&R benchmark is particularly helpful here.)
- Comparison with SOTA methods like PatchCore, WinCLIP, and Anomaly-OV — to understand what’s gained or lost when we remove code, training, and pipelines
We’re excited to explore these directions next — and curious to see what others discover when they try prompting VLMs for anomaly detection.